Here is the first of a series to come during the off-season taking a look at those all-important intra-team rivalries. As usual I've played around with Excel, this time to produce a chart to hopefully combine a flavour of both race and qualifying performances. I'll go through in no particular order, and we're starting with the CTA Midfield Team of the Year, Force India.

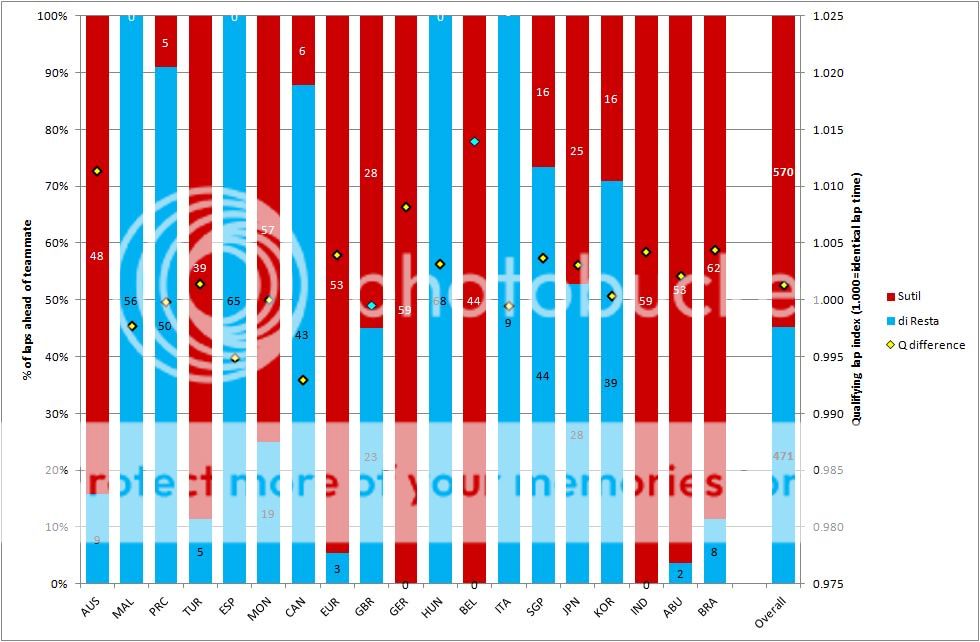
The bars show the share of laps in each race that each driver was running ahead of the other: so for example, at Melbourne, Sutil was ahead of di Resta for 48 laps, while Paul was ahead for the other 9. The comparison stops if either of the drivers retires, hence there are only 9 laps counted for Monza, for example. The share of laps as a percentage is given on the left-hand axis, for easy reference.
The yellow diamond markers show the relative qualifying performances, with the direction from the 1.000 line on the right-hand axis showing which driver was ahead (i.e. above the line is Sutil quicker; below di Resta), and the distance is a measure of the size of the gap. So di Resta's best qualifying performance of the year relative to Sutil was at Canada - around 0.7% faster. The markers are blue for Great Britain and Belgium to remind us that those sessions were rain-affected.
There's an overall column at the end giving the total laps for the season, and the average qualifying difference. Note that the two wet sessions aren't included in the overall qualifying difference.
Here also are the actual qualifying and finishing positions:
Hopefully this approach will help us to review both how the two drivers performed relative to each other in general, but also highlight any trends or developments over a season. In this case, for example, up until India it was actually di Resta who had spent most laps ahead of Sutil during the season. Adrian obviously had a very strong finish with better qualifying in all the last six races, and a more consistent gap to his team-mate too.
So are there any surprises in there? Paul started the season strongly and rather tailed off, which is an unusual pattern for a driver in his first season. He also seemed to do better when the car wasn't as quick - finishing ahead of Adrian at Sepang, Shanghai and Catalunya, but only scoring one point for those efforts.

The bars show the share of laps in each race that each driver was running ahead of the other: so for example, at Melbourne, Sutil was ahead of di Resta for 48 laps, while Paul was ahead for the other 9. The comparison stops if either of the drivers retires, hence there are only 9 laps counted for Monza, for example. The share of laps as a percentage is given on the left-hand axis, for easy reference.
The yellow diamond markers show the relative qualifying performances, with the direction from the 1.000 line on the right-hand axis showing which driver was ahead (i.e. above the line is Sutil quicker; below di Resta), and the distance is a measure of the size of the gap. So di Resta's best qualifying performance of the year relative to Sutil was at Canada - around 0.7% faster. The markers are blue for Great Britain and Belgium to remind us that those sessions were rain-affected.
There's an overall column at the end giving the total laps for the season, and the average qualifying difference. Note that the two wet sessions aren't included in the overall qualifying difference.
Q2 times have been used for the qualifying comparisons in all cases except BEL (di Resta failed to progress) and AUS (Sutil's Q2 time was nearly 5s slower and unrepresentative), when Q1 times have been used. On the three occasions that both cars progressed to Q3, one or both of them failed to set a competitive lap time.
Here also are the actual qualifying and finishing positions:
| AUS | MAL | PRC | TUR | ESP | MON | CAN | GBR | GER | HUN | BEL | ITA | SGP | JPN | KOR | IND | ABU | BRA | |
| Sutil (Q) | 16 | 17 | 11 | 12 | 17 | 14 | 14 | 11 | 8 | 8 | 15 | 12 | 9 | 11 | 10 | 8 | 9 | 8 |
| Sutil (R) | 9 | 11 | 15 | 13 | 13 | 7 | R | 11 | 6 | 14 | 7 | R | 8 | 11 | 11 | 9 | 8 | 6 |
| di Resta (Q) | 14 | 14 | 8 | 13 | 16 | 13 | 11 | 6 | 12 | 11 | 17 | 11 | 10 | 12 | 9 | 12 | 10 | 11 |
| di Resta (R) | 10 | 10 | 11 | R | 12 | 12 | 18 | 15 | 13 | 7 | 11 | 8 | 6 | 12 | 10 | 13 | 9 | 8 |
Hopefully this approach will help us to review both how the two drivers performed relative to each other in general, but also highlight any trends or developments over a season. In this case, for example, up until India it was actually di Resta who had spent most laps ahead of Sutil during the season. Adrian obviously had a very strong finish with better qualifying in all the last six races, and a more consistent gap to his team-mate too.
So are there any surprises in there? Paul started the season strongly and rather tailed off, which is an unusual pattern for a driver in his first season. He also seemed to do better when the car wasn't as quick - finishing ahead of Adrian at Sepang, Shanghai and Catalunya, but only scoring one point for those efforts.